Thirty-eight Montclair homes have closed between $1M and $1.5M this year — and most of them were never listed there. If your search filter starts at $1M, you're shopping a market you can't see.
Freddie Mac's weekly survey printed 6.43% on Thursday — a seven-week low, down from 6.49% — while Bankrate's daily average held closer to 6.54% heading into the holiday weekend. The gap between the two tells you rates are easing at the margin but haven't broken out of the mid-6s band they've occupied since May. Freddie noted purchase demand continuing to edge higher as buyers respond to the modest improvement in affordability. Across Northern New Jersey, that means the summer market is opening with slightly cheaper money and no less competition — as this week's numbers make painfully clear.
Pull the GSMLS record on every Montclair single-family that closed between $1 million and $1.5 million this year — there are thirty-eight of them through July 2, up from thirty-six over the same stretch last year — and a strange pattern emerges. The median sale price was $1,320,000, up ten percent from last year's $1.2 million. But the median list price of those same thirty-eight homes was $991,940. Read that again. The typical home that traded in Montclair's $1M–$1.5M tier this year was advertised below $1 million.
Fifty-eight percent of the tier's closings carried a list price starting with a nine — or an eight. Ninety-seven percent sold above ask. Eighty-two percent cleared their list price by twenty percent or more. The median winning bid ran $301,500 over the number on the sign, and the outer edge is genuinely startling: a Macopin Avenue colonial listed at $879,000 closed at $1,487,500 — 169 cents on the listed dollar.
This isn't a bidding-war story; it's an information story. In Montclair, the list price is not an estimate of value. It's the opening bid in an auction that resolves in about fourteen days. And that convention has a practical consequence almost nobody talks about: a buyer who sets a $1 million minimum on their search — perfectly logical if that's the budget — filters out the majority of homes they could actually buy. Right now only seven Montclair singles are listed between $1M and $1.5M, which looks like starvation. Widen the lens to the $800K-and-up window where this tier actually originates and there are eleven actives against twenty-nine pendings — call it 1.7 months of supply, with nearly three homes going under contract for every one sitting on the market. The tier isn't empty. It's disguised.

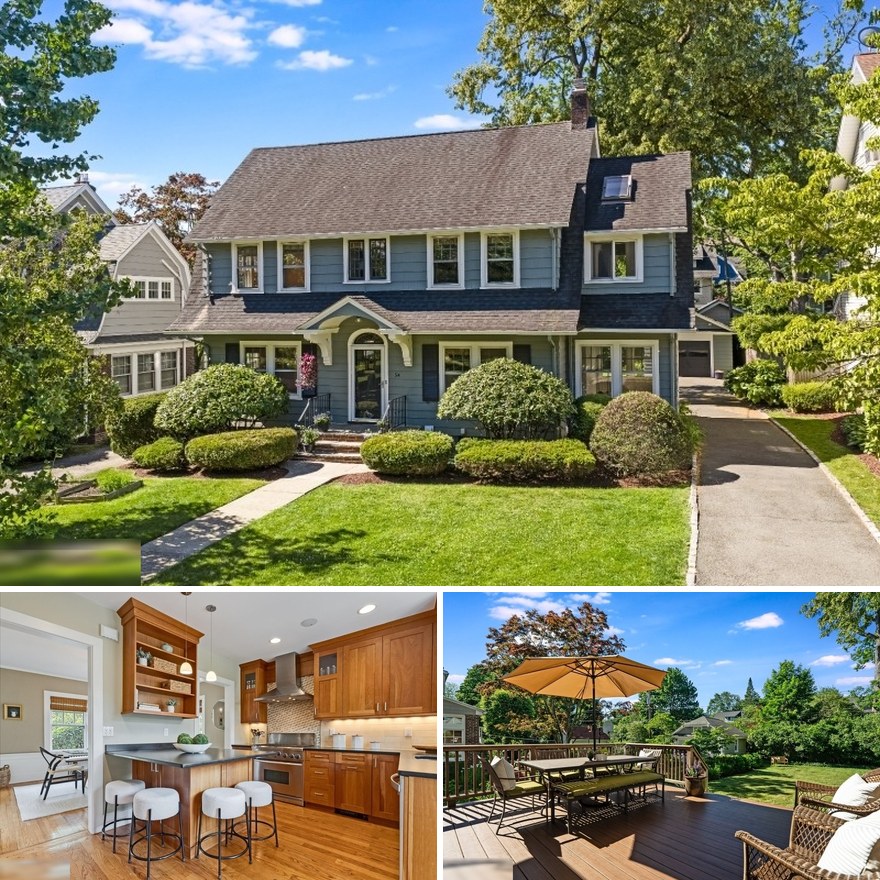
A 1912 Dutch Colonial at the top of Aubrey Road in the Watchung Plaza neighborhood, and a rarity in this week's dataset: a home listed inside the tier rather than beneath it. Four bedrooms and three-and-a-half baths across three finished floors, including a renovated kitchen with cherry cabinetry and leathered granite, a sunlit front room with built-ins, and a third floor with skylit flex space, a fourth bedroom, and a full bath with a clawfoot tub. The 60-by-144 lot backs to a deep, level yard with a detached garage. Showings only began June 25, so its fourteen days on market overstate its actual exposure — and fourteen days, as it happens, is exactly how long the median Montclair home in this tier lasted before going under contract. Taxes run $24,527.
If you're a buyer holding a $1M–$1.5M budget anywhere in Essex County, the homes you'll end up bidding on are mostly hiding below your search floor. I can set up a private MLS feed built around what homes actually trade for, not what they're listed at. And if you're a seller, this data is the strongest argument I know that a list price is strategy, not arithmetic: the market sets the number, and positioning determines how high it climbs.
For a real example of how disciplined pricing strategy plays out, see our 31 Hay Ave case study.
Book a Quick 1-on-1 North Jersey Real Estate Consult
Why did homes listed under $1 million sell for more than $1.3 million in Montclair?
In Montclair's most competitive price band, the list price often functions as an opening bid rather than an estimate of value. Through July 2, 2026, 58% of single-family homes that closed between $1M and $1.5M were originally listed below $1 million, and 82% sold at least 20% over their asking price. The median winning bid ran about $301,500 above list.
How many months of housing supply does Montclair's $1M-$1.5M tier have?
Measured against the $800K-and-up window where these sales actually originate, Montclair single-family inventory in mid-2026 sits at roughly 1.7 months of supply — with about eleven active listings against twenty-nine homes under contract, or nearly three pendings for every active.
Should buyers set their home search filter at their maximum budget?
In markets like Montclair, a search filter that starts at $1 million can hide the majority of homes a $1M-$1.5M buyer will actually end up competing for, because so many of those homes are listed below $1 million and bid up. Setting the filter floor well below your ceiling — and working from recent sold prices rather than list prices — surfaces the real opportunity set.
What were mortgage rates in early July 2026?
Freddie Mac's weekly Primary Mortgage Market Survey reported a 30-year fixed average of 6.43% for the week ending July 2, 2026, a seven-week low. Bankrate's daily average sat closer to 6.54% over the same period. Rates have held in the mid-6% range since May.
Market data: GSMLS, single-family closings in Montclair Twp. (YTD through July 2, 2026). Mortgage rates: Freddie Mac PMMS and Bankrate. Eric DeSilva, The DeSilva Team, eXp Realty · 973-542-9302 · hello@thedesilvateam.com
Why did homes listed under $1 million sell for more than $1.3 million in Montclair?
In Montclair's most competitive price band, the list price often functions as an opening bid rather than an estimate of value. Through July 2, 2026, 58% of single-family homes that closed between $1M and $1.5M were originally listed below $1 million, and 82% sold at least 20% over their asking price. The median winning bid ran about $301,500 above list.
How many months of housing supply does Montclair's $1M-$1.5M tier have?
Measured against the $800K-and-up window where these sales actually originate, Montclair single-family inventory in mid-2026 sits at roughly 1.7 months of supply — with about eleven active listings against twenty-nine homes under contract, or nearly three pendings for every active.
Should buyers set their home search filter at their maximum budget?
In markets like Montclair, a search filter that starts at $1 million can hide the majority of homes a $1M-$1.5M buyer will actually end up competing for, because so many of those homes are listed below $1 million and bid up. Setting the filter floor well below your ceiling — and working from recent sold prices rather than list prices — surfaces the real opportunity set.
What were mortgage rates in early July 2026?
Freddie Mac's weekly Primary Mortgage Market Survey reported a 30-year fixed average of 6.43% for the week ending July 2, 2026, a seven-week low. Bankrate's daily average sat closer to 6.54% over the same period. Rates have held in the mid-6% range since May.
Figures in this edition reflect data as of the original send date above and are not updated retroactively; treat this as dated market commentary, not a current snapshot. Rate and market data as cited in the original edition; imported from The DeSilva Team's newsletter archive.